| |
Methods
The
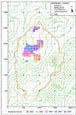
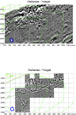
entire spring season was devoted to electrical resistivity survey (Fig.
10) with a Geoscan
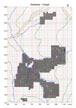
RM15 machine. Data was processed using Geoplot while image enhancement
was done with Surfer software (Fig. 11).
The memory in the RM15 permits the survey of up to a maximum of nine 20m
by 20m grids per day with a sample density of readings every 0.50m at
0.50m traverse intervals. A combination of inclement weather, areas of
difficult terrain and hardware problems reduced the average rate of coverage
to slightly more than seven grids per day. A total of 175 grids, totalling
70,000m2 or seven hectares, were surveyed in the course of 24 working
days.
Aims
In spring, when the ground is still wet, conditions are ideal for resistivity
survey. There were three aims for 2005 (Figs 10
and 11):
1. To link the two main areas of resistivity survey done in previous seasons;
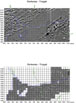
2. To survey one particularly large rectangular compound where the boundaries
were visible on balloon photographs as well as on the ground, but where
magnetometer survey does not produce clear images of internal structures
(Fig. 12,
NE corner);
3. To survey the urban block and its environs in the northern sector of
the city where test trenches TT15, TT20 and TT21 were dug in 1996 and
1998.
In the descriptions and interpretations that follow, use has been made
of all methods of survey carried out at Kerkenes, i.e. balloon photography,
resistivity and gradiometer survey, and verification on the ground. Where
relevant, results from test excavations in 1996 and 1998 have also been
taken into account in this report. Coordinates, where given, always refer
to the south-western corner of a grid, structure or feature.
Test excavations confirmed that visible differences in results between
both methods of geophysical survey are indications of different buried
surfaces, notably burnt clay floors of roofed structures and external
stone pavements. Further, comparison of the two sets of data make apparent
some of the ways in which burning has had an effect on the magnetism.
Central
Area
The
Central Area (Fig. 13)
has been the main target of the resistivity survey since 2001 when Harry
von der Osten obtained images of outstanding quality. During the 2005
survey, the area east of the Büyük Göl, surveyed in 2002,
was expanded on either side of the seasonal stream flowing westwards towards
the main watercourse and linked to the main survey.
The Urban Fabric
The maps of the Central Area obtained from the resistivity data have revealed
the urban fabric of the Iron Age city with remarkable clarity (Figs 14
and 15). The
size and shape of structures, even when not visible on the ground, can
be determined from the images and digitised for analysis with GIS software.
Studies related to building typology, transportation and water management
are ongoing at METU and the CAMEL Laboratory in Chicago.
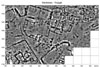
The Large Urban Compound
Advantage was taken of very damp conditions at the start of May to investigate
one particularly large urban block on the rising eastern margins of the
Central Area, located by its southern corner at E1088, N2015 (Figs 11,
12
and 15). The
boundaries could be seen on the surface and it was evident that it was
bounded by a broad street on the NE side and, most probably, by streets
at either end. At the outset it was not certain if the level walled area
adjacent to the NW edge of the block was an extension of the block itself
or a street. The main objective was to establish whether or not this block
contained a large two-roomed hall. The excellent results (Fig. 15)
showed that at Kerkenes considerable potential for resistivity survey
exists, even over stony areas, when there is sufficient ground moisture.
The entire block measures about 63m NW-SE by approximately 50m NE-SW,
making an area of c. 3,150m2. The extent to which the terrain has been
artificially levelled is uncertain. There is no visible entrance into
the block on the NW, NE or SE sides. Thus the most probable location for
an entrance is towards the NW end of the SW boundary wall where there
are two circular piles of stone. These stone features, together with a
number of smaller but similar features in the vicinity, postdate the destruction
of the Iron Age city. Some of these stone piles would appear to mark tumuli,
and in this they resemble the tumuli on the high southern ridge, some
of which contain stone cists and almost all of which have been robbed.
Other piles of stone seem to be associated with the activities of shepherds.
Within the block there is no single building which stands out as having
been of some special importance. Rather, the block appears to be subdivided
into several subunits which, while discrete, seem to have shared a common
entrance into the block.
The North End
There were three objectives to the resistivity survey at the north end
(Fig. 16).
Of these, the first was to obtain resistivity imagery (Fig. 17
bottom) of the large two-roomed hall and associated structures that had
been investigated by excavation in 1996 (trench TT15) and 1998 (trenches
TT20 and TT21). This was in order to provide the maximum amount of information
concerning subsurface remains with respect to the possibility of conducting
further excavation in this area in the future. In addition, it was of
particular interest to see if resistivity survey would locate the twin
rows of (uncut) granite bases for large wooden columns, the existence
of which was demonstrated by excavation but did not show on the gradiometer
shade plot (Fig.17
top). Unfortunately, neither this recent survey nor previous geophysical
survey of similar large halls at other locations within the city has yielded
such evidence and, therefore, the reconstruction of rows of columns has
been necessarily conjectural.
A second objective was to see if there were similar large halls in what
appeared, on the basis of gradiometer survey and balloon photography,
to be urban blocks divided by streets. It will take several additional
seasons to cover the entire area of interest since at this welldrained
north end the ground dries faster than in lower central parts of the city,
thereby restricting the length of the survey season.
The third objective was to examine the shallow grass-covered valley where
previous work had suggested the existence of sophisticated water management
systems followed by the encroachment of relatively slight structures onto
previously wet and marshy areas.
The Hall
The hall and anteroom (Figs 16
and 17)
were shown to be 24 metres in width, needing beams or trusses to span
8 metres between two rows of columns. The building was rectangular and
the hall, unusually, seems to have been square. These proportions might
partly reflect the restrictions imposed by the sloping terrain and outcropping
bedrock. It was also revealed that there was a wide central doorway, presumably
for wooden double doors, in the wall between the anteroom and the main
hall. However, in the front wall of the building no doorway can be discerned
on either the magnetic or the resistivity map.
Water Management and Encroachment
The 2005 resistivity survey has provided a little additional clarity while
confirming the general picture of features that are very probably to be
associated with water management. The new image makes certain that there
was not a reservoir directly in front of the block just described, and
perhaps provides further evidence in support of the idea that stone channels
were used to drain water and direct it into pools and a large reservoir
to the WSW. Located at E820, N2440 one pool, if such it is, has parallel
sides and rounded ends. Orientated east-west it is 35m long and 8m wide.
Verification on the ground confirms that this was not a standing structure.
On the other hand, a sinuous feature showed by test excavation to be made
of stone, appears to run into it and makes a sharp turn to the SSE at
its E end. Features stretching NWSE across the centre of this enclosure
are surely buildings of Iron Age date. |