   |
|
|
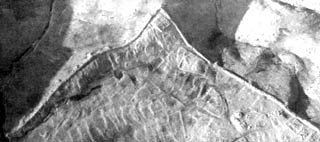
Figure 13:
The northern area of the city as seen from the hot air baloon. |
|
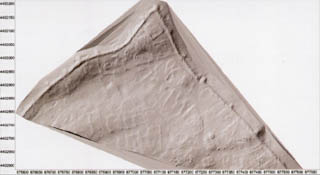
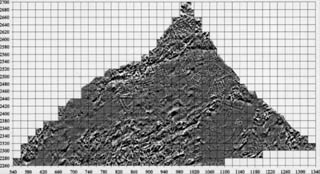
Figure 14:
A GPS surface map of the northern area prepared by Scott Branting from a
portion of the data collected in 1998. |
|
Figure 15:
Geophysical map of the northern area. Data processed with GEOPLOT and
displayed on SURFER by Nahide Aydin. |
| ------------ |
------------ |
|
 |